Octolamp
July 2025–present
Overview
Octolamp is a interactive data visualisation tool for United Kingdom local elections.
It uses the OpenLayers JavaScript library in conjunction with the Office for National Statistics'
GeoJSON data of local authority boundaries
to render three vector maps of different tiers of UK local government authorities, which are then colored in using a JavaScript function that runs on the results data.
The GeoJSON data uses different EPSG projections depending on when it was released, so I created a converter to handle this.
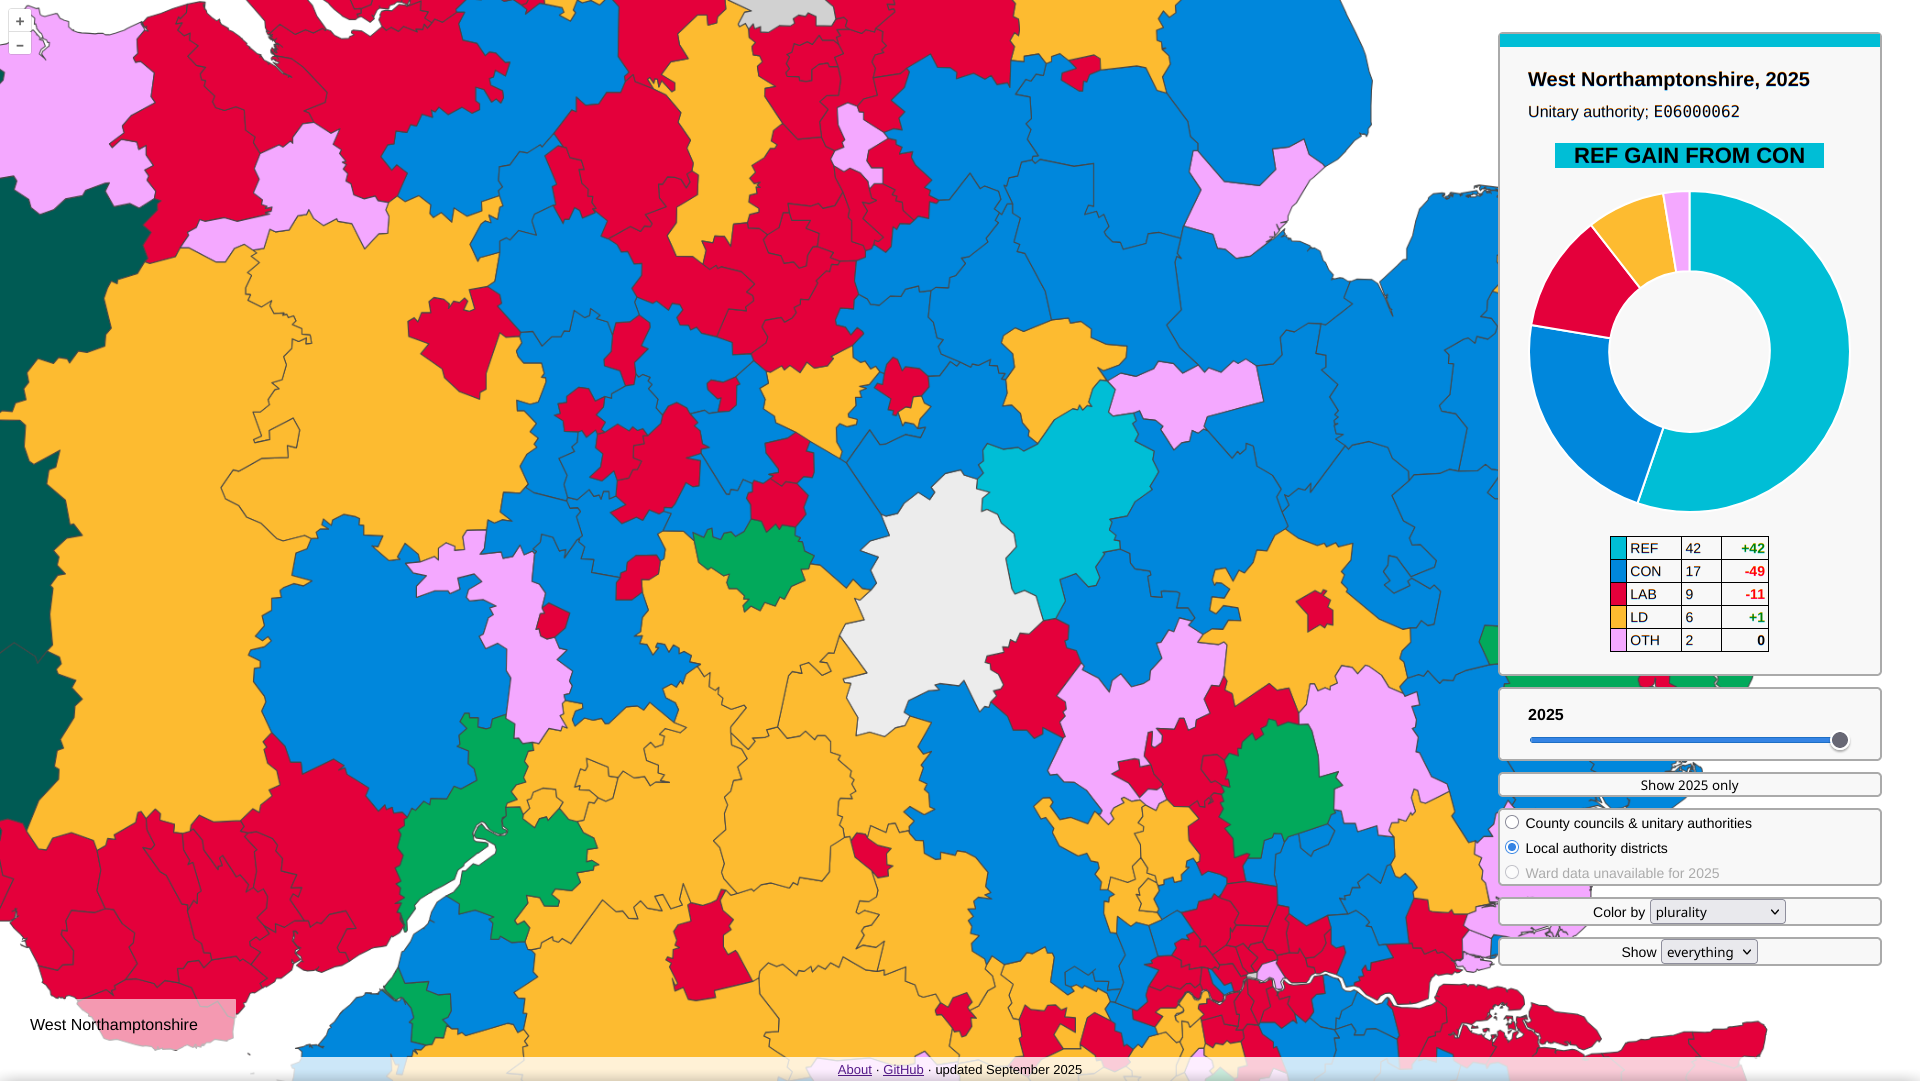
A box in the top right shows a chart (via ChartJS) and a table with more information on the selected election result.
The results data visualised is made up of a series of JSON files. These are generated from datasets compiled by the House of Commons Library. The HOCL provides
these datasets in the CSV format—I wrote a series of Python scripts to convert the data into the JSON that Octolamp uses.
Results for the following elections are viewable:
- 2016–2025 elections to unitary authorities, district councils, county councils, metropolitan and London boroughs, and Scottish and Welsh unitaries
- 2021–2024 elections to district councils and unitary authorities broken down by ward
Views available:
- Color area by control
- Color area by plurality (largest party)
- Color area by party that made the largest gain of seats
- Color area by party that had the largest loss of seats
- Filter areas to see the control of all councils in a given year (no filter)
- Filter areas to see only those up for election in a given year
- Filter areas to see only those which changed from one party's control to another
- Filter areas to see only those which changed control (including to no overall control)
Screenshot